





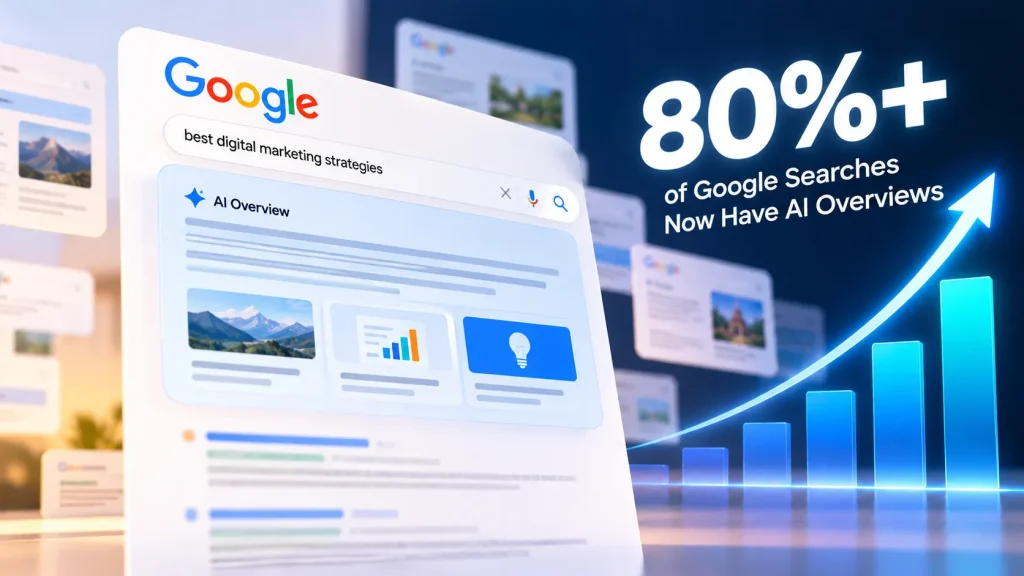
AI Overviews are now being shown on over 80% of Google searches, up from around 50% at the time of the same report last year, according to a Search Engine Roundtable report from Barry Schwartz.
This is based on recent data from three different SEO tools (Semrush, SE Ranking and seoClarity). As they all measure AI Overviews slightly differently, you can see how the figures vary depending on the tool, type of query and industry.
How Fast The Number Has Grown
AI Overviews showed up on 50% of searches in June last year. This was a jump from last year, where there were just 15% of AI overviews. Now we have over 80%.
This shows a steady increase in the percentage of searches using AI Overviews. 15% increased to 50%, then to over 80%. Compared to the 15%, this is over five times as much. Compared to June last year, it has increased by over 30%.
There was an increase from roughly 15% to 50% which means an increase of around 35%. There was then a further increase of at least 30% from 50% to over 80%. We do not know how many months have passed between the two data points so this should be seen as a general trend.
We do not know the exact percentage currently, however we do know it is over 80%. The percentages are taken from the three tools above.
What The Semrush Data Shows
This data is available from Semrush. You can track how the percentage of searchers getting an AI Overview has changed over time using the chart below.
They have also created a detailed study looking at this data in further detail, including how many are getting it per industry and type of query. One chart from this report has been shared below by Search Engine Roundtable comparing AI Overview usage by industry. However, if you want to know how much your industry is being used you can check out the Semrush report.
What The SE Ranking Data Shows
SE Ranking has looked into brand searches and says in new data that AI Overviews are now present on 82.5% of brand searches in the U.S.
But only for brand searches (when you search using a brand name). As it’s only for branded searches he assumes that there will be much higher rates for many non-branded searches. However, this data isn’t shown in this report.
Brand Searches Compared With All Queries
We can see two data points here. The first is from SE Ranking and shows that 82.5% of brand searches in the US using SE Ranking. Meanwhile, we can look at the data from seoClarity which shows more than 62% of searches across queries. This is a big gap of around 20%.
This isn’t a like for like comparison as one is specifically looking at branded searches while the other has a wider range. We’d expect many non-branded searches to have a higher proportion. The seoClarity data is looking at a wider range of searches, but has a lower % than branded. This means it doesn’t really give us a clear answer.
What The Seoclarity Data Shows
Mark Traphagen from seoClarity told Schwartz that they are seeing over 62% of queries coming through as AI Oversights. However, he also mentioned that this number can vary between 55-84% per industry.
This data is older and comes from around a month ago. It shows a chart of the data for U.S keywords. It may not be in line with the more recent data from Semrush and SE Ranking due to how old it is.
Differences Between Industries
The industry of the website can play a huge role. As you can see in the image below, there is a big range of results from SEO clarity from 55% to 84%. This means there is a range of 29 percentage points. At the lower end of the range only just over half of queries will include an AI overview, and at the higher end over 4 out of 5 will include one.
The Semrush study also shows a breakdown of data based on industry and query type. As shown below, it seems that there is a large difference in the amount of queries including AI overviews across different sectors. The industries that are the highest and lowest can be seen in the studies below.
Why The Numbers Differ
The difference between the three results can be seen in the report. The search volume percentage for brand searches was used for SE Ranking. A selection of queries were used for seoClarity and the percentage was split into ranges depending on the industry. Semrush shows the overall search volume percentage but expands on this with their study. The queries used for each tool will be different.
The date also affects the results. The result from seoClarity is roughly from a month ago whereas the headline result is using the most recent data. Additionally, the 62% and 82.5% are answering slightly different questions. 62% shows what percentage of all queries in the seoClarity data are brand searches whereas 82.5% shows what percentage of brand searches in the U.S. are for this brand from the SE Ranking data.
When reporting on this it would be safest to state which tool and type of search you’re using. This has been done in the report below.
Earlier Reports On The Trend
Schwartz says the finding is not surprising. He says a month ago Search Engine Roundtable reported on how Google has been showing an extensive range of AI Overviews during brand searches and even fake/incorrect queries.
Schwartz says the two reports tie into Google’s overall mission to ensure there will always be an answer to any query. This is why we are seeing consistent increases in the amount of coverage being shown.
The previous reports were from Search Engine Roundtable themselves a month ago. This new data just provides numbers to back up the trend we have seen.
The Figures In One Place
To give you a quick overview of the numbers in this report. Google now sees over 80% of search queries. In June last year, it was only at 50% and the year before that was around 15%. SE Ranking shows that 82.5% of Brand searches in the U.S. are from Google. SEOClarity also has some great stats showing that over 62% of queries come from Google. Depending on the industry they range between 55-84%
All of these stats come from different sources and have different scopes. The easiest way to ensure that you know which stat relates to which source is to keep them separated.
The Reporter’s View
Schwartz concludes his report by stating that while the data wouldn’t come as a shock to those in the search industry, it does give us an opinion. “Google is really going all in on AI Overviews.”
This is a personal opinion based on the data provided. Whilst the numbers do support the trend and show a consistent increase from the three sources, this is a personal opinion.
What The Report Does Not Say
The report is a short summary of data from three tools. It does not explain how each tool collects its searches. It does not give the exact Semrush figure in text, and it does not state how many queries SE Ranking or seoClarity reviewed.
It also does not say what the rise means for clicks or traffic to websites. It reports how often AI Overviews appear, not how people interact with them. Anyone who needs those details would have to look at the studies and tools the report links to.
FAQs
Q 1: What share of Google searches now have AI Overviews?
More than 80%, according to Search Engine Roundtable. The figure comes from recent data from Semrush, SE Ranking and seoClarity.
Q 2: How has the share changed over time?
It was about 15% two years ago and 50% in June of last year. It is now above 80%.
Q 3: Which tools supplied the data?
Semrush, SE Ranking and seoClarity supplied the data cited in the report.
Q 4: What did SE Ranking find?
SE Ranking says AI Overviews appear on 82.5% of U.S. brand searches, based on its published data. The figure applies only to branded queries, so it should not be read as a share of all searches.
Q 5: What did seoClarity report?
We are seeing them appear in over 62% of our queries according to Mark Traphagen in an interview with Schwartz. Depending on the industry we are seeing between 55-84%.
Q 6: What does the Semrush study cover?
It shows a breakdown of AI Overview data based on industry and query type. You can view the full results here.
Q 7: Why do the percentages differ between tools?
Each tool measures different aspects. SE Ranking only looked at brand searches whereas seoClarity looked at all queries across different industries. The data would also have been collected at different times.
Q 8: Are AI Overviews limited to certain types of searches?
No. The report says they appear for many brand searches and also for fake or incorrect queries.
Q 9: What does Schwartz think Google is doing?
He says the trend is part of Google’s plan to always have an answer for any query. He also says Google is going all in on AI Overviews.
Q 10: Does the report say how this affects website traffic?
No. It covers how often AI Overviews appear, not how they change clicks or traffic.
